User Manual
This application is part of the IMRT QA Data Mining (IQDM) project for the AAPM IMRT Working Group (WGIMRT).
Introduction
IQDM Analytics is a desktop application designed to make IQDM-PDF more user friendly. IQDM-PDF is a python library used to mine data from IMRT QA PDF reports for the purpose of generating control charts, as recommended by AAPM TG-218.
Usage
The easiest way to use this application is to download an executable from the attachments in the latest release of IQDM Analytics.
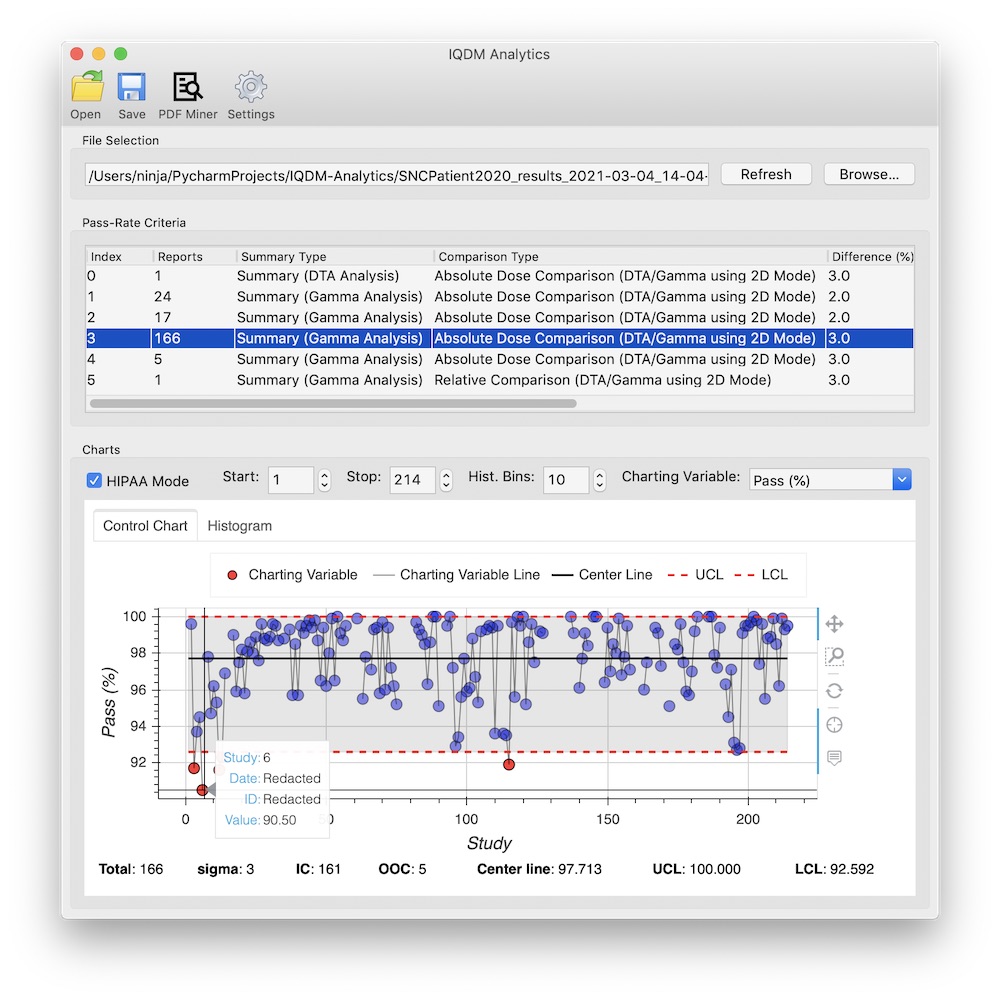
Once you’ve launched the application, click on the PDF Miner icon in the toolbar. From there you can select a directory to scan and another to store a CSV file of mined data. Once this is complete (or if you already have an IQDM-PDF CSV file), click on Open in the toolbar of main window to import the CSV file.
The visuals are created with Bokeh and can be exported to HTML, SVG, or PNG files. Clicking the Save icon in the toolbar will open a window allowing you to apply temporary visual customizations prior to export. Alternatively, you can edit these visuals in Settings to store the changes permanently.
Supported Vendors
IQDM-PDF currently supports the following IMRT QA vendors / reports:
Sun Nuclear: SNC Patient
Scandidos: Delta4
PTW: Verisoft
Methods
PDF Mining
Generally speaking, the text from IMRT QA reports is extracted and sorted into boxes with coordinates, using pdfminer.six. Then IQDM-PDF searches for keywords to locate boxes containing data of interest. For more details, see the IQDM-PDF: How It Works page.
Although IQDM-PDF has very thorough testing, it is prudent for users to manually inspect the CSV file generated. If you find an error, please submit an issue with IQDM-PDF. If you provide an anonymized report reproducing the error, it can be included in the automated tests.
Data Parsing
Output from IQDM-PDF will be sorted in the following order:
Patient Name & ID ( & Plan ID/Name/SOPInstanceUID if available)
Analysis parameters (e.g., dose, distance, threshold, etc.)
Measurement date & time (or report date)
If multiple reports are found with this sorting, IQDM Analytics can be customized to select either the first or last report (by file creation timestamp), or be set to the min, mean, or max value (calculated per charting variable). See “Duplicate Value Policy” in Settings.
Control Charts
A control chart is simply a plot of chronological data with a center line and control limits (upper and lower). The center line is the mean value of all points. IQDM Analytics calculates a 2-point moving-range,
Control limits (\(CL\)) are calculated with
where \(3\) is the number of standard deviations, which can be customized in Settings. Since the chart is based on a 2-point moving-range, \(1.128\) is used (i.e., the value of \(d_2\)). Note that control limits are bounded if the population it describes also is bounded. For example, the UCL of a gamma pass-rate will not exceed 100%.
The control chart in the main view uses the following acronyms:
IC: In Control
OOC: Out Of Control
UCL: Upper Control Limit
LCL: Lower Control Limit
CSV Parsing
If you are opening a CSV file generated by IQDM-PDF, its format will be
automatically detected and loaded based on instructions from its matching JSON
file found in ~/Apps/iqdm_analytics/csv_templates. If you develop your own
data mining script, you can still use IQDM-Analytics if you create a CSV
template (JSON formatted). Below is a simple example:
{
  "columns": [
    "patient",
    "plan",
    "field id",
    "image type",
    "date",
    "DD(%)",
    "DTA(mm)",
    "Threshold(%)",
    "Gamma Pass Rate(%)"
  ],
  "analysis_columns": {
    "uid": [0, 1, 2],
    "date": 4,
    "criteria": [5, 6, 7],
    "y": [
      {
        "index": 8,
        "ucl_limit": 100,
        "lcl_limit": 0
      }
    ]
  }
}
columns
This is a list of columns to be imported, their values must match EXACTLY with the column header in your CSV.
analysis_columns: uid
This is a list of column indices, that when combined, create an ID that is unique to an “observation” or “case”. This is used to catch duplicate reports being read. You may specify as column headers instead of indices.
analysis_columns: date
The assigned date for chronological sorting is based on this column index. You may specify as a column header name instead of a column index.
analysis_columns: criteria
These indices are used to “widen” the data (i.e., separate your reports by pass-rate criteria). Generally speaking, this is really a list of independent variables.
analysis_columns: y
This is a list of dependent variables available for charting. Each item in this
list must be a dictionary with the keys index, ucl_limit, lcl_limit.
If the charting variable has no bounded control limits, or you do not know them,
set the limit values to null (e.g., "ucl_limit": null). The value for
index may also be a column header instead of a column index.
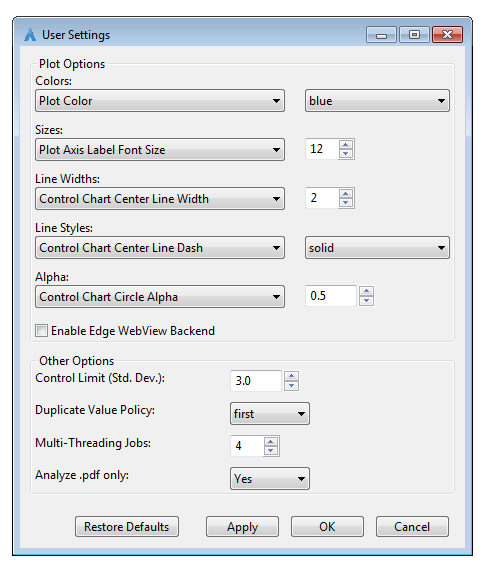
Settings
The Settings window allows you to customize plot visualizations such as colors, widths/sizes, line styles, and transparency (alpha). Additionaly, there are the following options:
Control Limit standard deviations
Set the number of standard deviations for UCL/LCL calculations
Duplicate Value Policy
If multiple reports are found for a given patient/date/ID, use either ‘first’, ‘last’, ‘min’, ‘mean’, or ‘max’ value
If “Enable Duplicate Detection” is unchecked, all reports will be considered unique observations / cases.
Multi-Threading Jobs
IQDM-PDF supports multi-threading, set the number of jobs used for PDF parsing
Analyze .pdf only
IQDM-PDF looks only at .pdf files by default, allow it to try parsing any file
Windows Users
The framework used to build this application (wxPython) leverages your operating system’s web viewer to render web pages (such as the Bokeh visuals in this application). Unfortunately, Windows still uses Internet Explorer (IE) emulation. This means there is no drag functionality (so no pan or zoom). These features can be recovered if you install Microsoft Edge Beta. If this is installed, you should be able to check “Enable Edge WebView Backend” in Settings. Note that it is much slower to initialize, but you can pan, zoom, and show/hide plot components when clicking on legend items.
Alternatively, you can export your chart as html or navigate to
~/Apps/iqdm_analytics/temp where the last chart you generated will live
as an html file until you render a new one in IQDM Analytics. Then open the
file in your browser of choice for full interactive functionality.
Local File Storage
IQDM Analytics will create the directory ~/Apps/iqdm_analytics. Your
options are stored here as a hidden file .options. This directory also
contains csv_templates, logs, and temp directories. The
csv_templates contains instructions for CSV parsing - stored as JSON files.
The logs contains a iqdma.log file if any python errors have been
caught. This file will be helpful when reporting any issues. The temp
directory is currently only used for html file storage on Windows.
PyInstaller
The executables for IQDM Analytics are generated with PyInstaller,
which basically packages a full version of python and necessary libraries.
When you run the executable, it unpacks into a temp directory with a location
depending on your OS, but starts with _MEIxxxxxx where xxxxxx is a
random number. If the application crashes or you kill the application, just
note that this folder will not be automatically purged.